The following article was written by Xinshan Zhou
As it embodies a lot of what I consider to be important regarding the reasons that I first invested in silver when it was $5 per oz and why I have continued to hold and accumulate I asked if I could publish it here on my Australian Gold blog. Mr Zhou kindly agreed to my request.
The beginning of the silver age
A lot of people were knocked out of the gold and silver market because of panic during the last two weeks; they capitulated or sold short near the bottom. Many others exclaimed that the gold age was over. However, I see the rising sun in the morning. Both gold and silver will start a new age. In this paper, I’ll try to tell you why we are in the beginning of a more splendid era for gold and silver. I’ll also share with you why silver will be a supernova in the following decades.
1. Capitulation, Rivers of Blood
If you ask me which words I’d like to use to describe the gold and silver market in the last two weeks, “Capitulation, rivers of blood” is my answer. According to the Weekly Commitments of Traders Reports released by the CFTC, the net long of small speculators decreased by 24,310 contracts for gold and 7,846 contracts for silver from April 9 to 23. This means that a gigantic short position was transferred to small speculators from smart hands. The capitulation of small speculators always signals an end to the last bearish trend and the beginning of a new bullish trend. I hazard to say that gold price below $1,500 and silver price below $26 are the short traps. It will not last too long.
2. The Secular Trend of Gold and Silver Is Still Intact

Monthly Logarithm Chart of Gold Price
3. Celebrate the Birth of Wave III
Before introducing our leading character — silver — I’d like to expound on the wave information imprinted in figure 1. Some may argue that 20 months for wave II is too short to correct the 144 months in wave I. In my opinion, 20 months of correction is long enough. Why? First, a price correction of 36% is acceptable (1,923 – 1,323 = 600; 1,923 – 253 = 1,670; 600 / 1,670 = 36%). Second, the secular trend line support at point C is strong confirmation for the end of wave II. Third, the bearish market of gold and silver lasted too long, about 20 years, during the last super correction wave from 1980 to 2000, therefore gold needs to accelerate its speed upwards to make up for the lost time. Last but not least, if we consider the abnormal global currency printing speed today, I would say 20 months of correction is too long.
Both gold and silver are at the beginning of wave III. There might be another down leg in the daily chart to confirm the bottom next month, but that may not occur. It is a rare opportunity now to enter for those who missed wave I. Generally, wave III will run faster and gain much more compared with wave I. It will probably take gold to $10,050 to $16,000 per ounce in circa 5 to 8 years or even faster. Meanwhile, silver will go to $500 to $1,100 per ounce then.
An alternative method to count waves is to separate the gold trend into nine waves for this super-cycle after 1999. It’s in the beginning of wave 7 now. Currently, silver can also be considered to be at the beginning of wave 3 in wave III. Personally, I think all these counting methods are correct. We all know that theory wave explains the history better than it forecasts the future, so there should be multiple methods to count waves.
4. Silver: Cup with Handle Pattern
The silver chart will provide a classical cup with handle pattern for future investors to study. The body of the cup is finished already. We are waiting for the completion of the handle. Because the cup lasted 31 years, the handle needs a few years to make it strong enough to hold the cup. Personally, I think it may take three or four years this time. That means silver price will break through the neckline at $50, or its historical high, in 2014 or 2015. Generally, the potential gain from the neckline will equal to or exceed the body size, 14.37 fold. Therefore, the next station for silver is $700+ / oz after the completion of cup with handle pattern. Silver may yield another body size in one or two decades, the price will be higher than $10,000/oz then.
Figure 1 is the monthly logarithm chart of gold price. We can see a secular trend line A-B-C. It’s really miraculous to witness gold eventually find its support in such a perfect pattern. I don’t need to say anything more. Just remember the price and the date, $1,323/oz on April 15. It will probably be the end of the last correction wave which lasted about 20 months. Why do some people shout that the gold age is over? In fact, the real splendid bullish trend with an accelerated rising speed is just beginning. The long period trend of silver is stronger than gold. Figure 2 is the quarterly logarithm chart of silver price. The $22/oz on April 15 did not even touch the A-B-C trend line. This price is just above silver’s high price in 2008, another way to confirm the end of the down trend. To respond to the so called “the gold age was over,” I would rather say that the door to a new gold age is just opening and the supernova silver is making its debut.

Quarterly Logarithm Chart of Silver Price
5. What Factors Support Silver Price Going up?
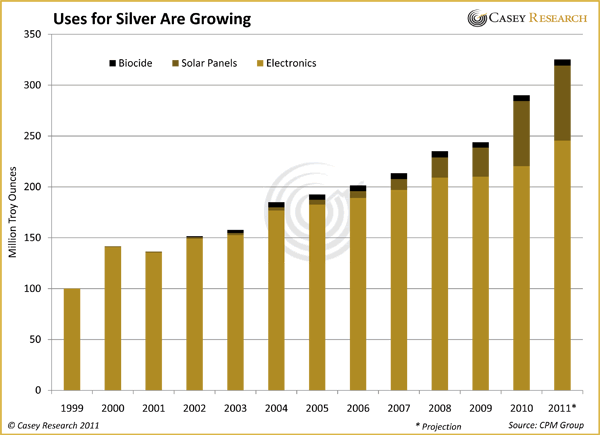
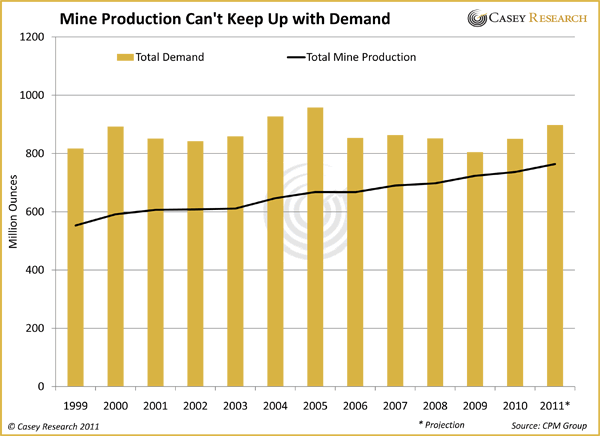
First, silver stock is decreasing. Humans have dug out about 50 to 60 billion ounces of silver and 5 to 6 billion ounces of gold up to now. Most of the gold, more than 90 %, is still there, but there are only about 1 billion ounces of silver left. More than 95% of silver was consumed by industry in the last century. Because of its incomparably excellent physical and chemical characteristics, silver is widely used almost everywhere such as in solar energy, television sets, computers, cell phones, digital cameras, all other electronic equipment and many other areas. The dwindling trend of silver stock will continue until silver is completely depleted. The decreasing silver stock is perpetual propulsion for silver price going up.
Second, global money supply is increasing dramatically every year. From January 1980 to now, the U.S. monetary base has increased 22 fold from $130 billion to $3,025 billion; China’s M2 has increased almost 800 fold from 130 billion yuan to 103.6 trillion yuan; all other countries have also increased their money supply. Total world money supply has increased above 22 fold, the same as the USA during this period. If we calculate the high price of gold and silver in 1980 with the current money supply, gold price will go beyond $20,079 / oz (873 x 23), and silver price will be higher than $1,158 / oz. Even though today’s gold stock is more than its stock in 1980 (increased about 50%), we can get gold price at $13,386 / oz (20,079 / 1.5). What about silver? Believe it or not, today’s silver stock is no more than one third of its stock in 1980. Therefore, the corrected high price for silver in 1980 should be above $3,500/oz. I expect to witness this price in 20 years.
Some may worry about what will happen if the central banks stop printing currency. Will the price of gold and silver go down then? First, no central bank wants to stop printing if they can print. The printing speed may slow down during some periods, but it never stopped in monetary history (details concerning this topic are beyond this article). Second, even if they want to stop printing, it’s already too late because they have printed too much. Keep in mind that silver stock will continually decrease and money supply will simultaneously increase. As long as the central banks can discretionarily print currency, the secular uptrend of gold, silver and all other commodities will never stop. Silver price will go higher and higher.
6. A Word to the Price Ratio of Gold and Silver
The price ratio of gold and silver should be in accordance with the ratio of the amount of silver and gold. What is the ratio now? How can we determine the ratio? It should be between 9 and 16. First, as I mentioned above, the ratio of all silver and gold dug by humans up to now is about 10. Second, the ratio of silver and gold dug by all countries in recent years is around 9. Third, according to U.S. Geological Survey, the ratio of available underground reserved silver and gold in the world is about 10. Last, surveys by geologists show that the amount of silver and gold in the earth’s crust is about 16:1. All these data suggests that the price ratio of gold and silver should be between 9 and 16. This is also coherent with the price ratio of gold and silver throughout 5,000 years of human history, which was between 8 and 16 most of the time.
Many people are accustomed to the high price ratio of gold and silver, it is about 60 these days. The possible reasons may be that they presume there is much more silver than gold, or the futures contract size designed for silver is 50 times that of gold in the United States. In fact, silver stock is less than gold stock today. Compared to more than five billion ounces of gold, there are only one billion ounces of silver available for investment now. The futures contract size ratio of 50 doesn’t mean the price ratio should be 50. If that is true, the price ratio should be 15 in China because the designed contract size ratio of silver and gold is 15 in all exchanges over there. Clearly, this is not true.
The cardinal reason that many investors buy gold is based on the assumption that gold is money. However, silver is also money and is depleting much faster than gold. Silver price must go up and will go up faster than gold price. Therefore, the price ratio of gold and silver will gradually go down to the area between 9 and 16 in the next few years and will continue to go down in the future.
Conclusion: Super Stars Come on the Scene!
I have demonstrated a panorama of the price uptrend of gold and silver in the next few years or decades from both technical analysis (trend, wave theory, statistics and patterns) and value analysis (supply and demand, money supply, hyperinflation and gold silver price ratio). I firmly believe that the price of gold and silver is extremely undervalued right now. The price slump two weeks ago provided a perfect purchasing opportunity for those who had no gold and silver in their portfolios. The potential yield could be eight to ten times or more for gold and dozens times for silver in the next few years.
Because the central banks can discretionarily print currency, super inflation will come and is inevitable. There are hundreds of examples of super inflation in human history such as Wiemar (1919 to 1923), China (1940 to 1948), Zimbabwe (2000 to 2010) and so on. People will lose confidence in all fiat currencies and rush to the real money – gold and silver. A new worldwide currency supported by gold or gold and silver will definitely come to fruition. April 15, 2013 was probably the beginning of a new uptrend for both gold and silver, and the transition from the gold age to the silver age.
Comments Off on The beginning of the silver age. By Xinshan Zhou


“With a building gigantic wave of large Quantitative Easing programs by Central Banks; the ECB, Bank of England, U.S. Federal Reserve, Japan Central Bank & China on the horizon, markets should brace for a quantum jump in Equity & Commodities in the second half of 2013…and beyond. It is imperative to remember the ECB encompasses 12 countries (Germany, France, Italy, Spain, Belgium, Greece, Ireland, Luxembourg, Netherlands, Austria, Portugal & Finland).”
Read more
Comments Off on Money Supply vs Gold price (1992-2013)
I find the arguments expressed below to be both compelling and useful and I thank Danny Laidler for his kindness in allowing me to publish it on our blog.
What’s Behind the Gold Price Drop and Will It Continue?
The violence of the fall in the gold price over the past few days has taken investors by surprise and has understandably led to questions about whether this is a short-term correction driven by technical and hedge fund-led speculative activity or if it signals the end of the 12 year gold bull market. Below we highlight some of the factors behind the recent gold price declines and our view of the longer-term outlook.
• What are the reasons for the downward trend in the gold price since October 2012 and does it represent an end of the 12 year gold price bull market?
• What triggered the very sharp sell-off in gold last Friday and Monday of this week?
• Is gold in a bubble?
• What is the outlook for the gold price?
________________________________________
• What are the reasons for the downward trend in the gold price since October 2012 and does it represent an end of the 12 year gold price bull market?
The gold price has been trending down since October 2012. The main reason for the fall in the gold price has been rising global growth expectations, particularly in the US, which has lifted interest rate expectations, ratcheted back quantitative easing expectations and boosted investor appetite for cyclical and risky assets. Normally this alone wouldn’t be enough to knock back the gold price, as during most risk-on moves the US dollar weakens which often helps support the gold price. However, because of the dire macro situation in Europe and aggressive quantitative easing by the Bank of Japan, during this risk-on move the US dollar has actually strengthened. This has added further impetus to the downward move in the gold price.
The gold price will face headwinds as long as US interest rate expectations continue to rise and the US dollar continues to strengthen. However, in our view these are tactical/cyclical factors that are temporary. The rise in developed economy debt burdens, driven by demographic change and entrenched interests, continues unabated. Interest rates will need to remain structurally low to offset fiscal drag, keep interest rate payments from ballooning and support growth. Quantitative easing expectations will ebb and flow with business cycle developments.
But until the countries backing the world’s major reserve currencies put in place credible policies to control their growing debt burdens, the public will look to gold as one of the few hard currency hedges against the risk these countries continue to try to reduce their real debt burdens through the debasement of the purchasing power of their currencies. Gold will remain in a bull market until these debt issues are resolved or a credible and liquid alternative to the current fiat reserve currencies emerges.
• What triggered the very sharp sell-off in gold last Friday and Monday of this week?
There were a number of fundamental, technical and investor behaviour factors that likely drove the most recent correction in the gold price. In our view it was a classic case of speculative investors taking advantage of gold-negative fundamental news and technical break-points to drive a self-fulfilling downward cascade of the gold price. Given the size of short COMEX futures positions, an equally powerful short-covering rally may also occur once markets have stabilized, new technical levels evolve and gold fundamental news improves. Below we list some of the fundamental and technical factors that may have helped catalyse the most recent frenzy of investor selling.
o The Fed FOMC minutes released on 10th April which showed some members favour an earlier exit from the quantitative easing (QE) than previously assumed.
o Reports that Cyprus was readying the sale of its excess gold reserves to help fund its government’s debt payments led to fears that the gold supply will increase. While Cyprus’ gold stock remains too small to have a material impact on gold prices, investors fear that other troubled European states could follow suit.
o Arguably the most important catalyst was that a number of gold price technical support levels were breached (with some saying they were strategically pushed through by well-timed large hedge fund selling), triggering margin calls, momentum and model-based investor selling. This then created a cascading and self-fulfilling downward spiral in the gold price.
• Is gold in a bubble?
Looking at the past 10 year performance of gold to known historic bubbles in other assets, we can see that price gains in gold have been modest. For example looking at the 10 years running up to the peak of the NASDAQ bubble of 2000 and the gold bubble of 1980, the rise of the gold price seems far from excessive. With gold price at a 2-year low, this could be perceived as a potential buying opportunity. The governments backing the world’s major reserve currencies are faced with extremely large and growing debt burdens. Ageing populations and insufficient working population to support current levels of benefits means that debt levels will swell significantly further without very substantial and politically painful cuts or tax rises. These can also be counter-productive to the extent they reduce economic growth and therefore government revenues. This puts government in a particularly tight bind. Europe faces the added problem of backing a single currency for countries with substantially different economic and social fundamentals. Until these issues are resolved there will be a natural demand from the public for alternatives to these fiat currencies. Gold historically has been the first stop of the public when it loses faith that governments will be able to pay back their debts without resorting to inflation/currency debasement. This time is unlikely to be any different.
• What is the outlook for the gold price?
The longer term fundamentals for gold remain strong and ultimately should re-assert themselves once cyclical and technical factors move again in gold’s favour. The fragility of the US recovery, on-going Eurozone weakness and continued high sovereign debt risks are likely to keep central banks firmly in aggressive stimulus mode. The growth of gold supply remains limited with production growing by just over 9% over the past decade and recent disruptions in South Africa threatening miners’ productivity. Emerging market central banks have become large net buyers of gold since 2010, equivalent to around 12% of total supply. Chinese physical demand is the second largest in the world, after India, with Chinese imports of gold now accounting for nearly 20% of total annual demand, from levels of under 3% 10 years ago. China’s demand for gold has been accelerating in recent months.
Given the technical nature of the recent sell-off, short term moves in gold are especially difficult to predict (both up and down). However, at these levels physical buyers – central banks, India and China jewellery demand, long-term strategic investors in gold – will likely start to emerge once the market calms down. Gold needs a positive impetus – a reduction in US interest rate increase expectations, signs of deteriorating European sovereign debt fundamentals, a weaker US dollar – to resume its bull market climb. However, with COMEX speculative short positions at all-time highs, in our view the likelihood of a short-covering rally are now higher than another large downward leg of the price correction.
ETF Securities – Largest Global ETC inflows:
– ETFS Physical Gold +26.4m
– ETFS Daily Leveraged Silver +11.4m
– ETFS Daily Leveraged Gold +5.2m
ETF Securities – Global ETC outflows:
– ETFS Physical Gold -29.5m
– ETFS Physical Platinum -14.2m
Direct investment in 22 commodities is now available to trade on the ASX via the ETF Securities’ Exchange Traded Commodity (ETC) platform, the product list and factsheets, PDS and educational factsheets are available at www.etfsecurities.com
If you have any questions, or require any additional information, please feel free to contact me.
Regards,
Danny
Danny Laidler
Head of Australia & New Zealand
ETF Securities (Australia) Pty Ltd
Tel: +61 293 653 639
Mob: +61 447 35 35 35
Email: [email protected]
Comments Off on What's Behind the Gold Price Drop and Will It Continue?
I wonder if this will provide the gold bulls with fodder?
US adds just 88,000 jobs in March
The US economy added just 88,000 new jobs in March, a reading sharply lower than economists’ expectations that is bound to raise concerns the labour market is entering a soft patch amid federal budget cuts.
According to data released on Friday by the labor department, the US unemployment rate ticked down to 7.6 per cent as the size of the US labour force showed a stiff decline.
Government employment fell by 7,000, offering evidence that austerity at the federal level was setting in gradually. But jobs in the private sector were much harder to come by than in February, with manufacturing losing 3,000 jobs, construction gaining 18,000 and retail losing 24,000.
http://link.ft.com/r/0QSDPP/T1CBKQ/TFCW1/NJYSRP/XBKXVI/CM/h?a1=2013&a2=4&a3=5
Comments Off on Gold, Silver to rise on poor US jobs figures – QE3 to contd. ?
A remote mine in northern Brazil is set to produce gold so cheaply that its Australian owner Beadell Resources Ltd. (BDR) could prove irresistible to a buyer.
Three months after pouring its first gold bar at the Tucano mine in Amapa, Beadell predicts the mine this year will become Brazil’s third-largest producer of the metal. With the benefits of low taxes and labor expenses, the Perth-based company plans to churn out bullion for 32 percent less than the average cost among peers worldwide, according to data compiled by Bloomberg.
The low costs are so appealing that Beadell could fetch 20 percent more than its A$623 million ($650 million) market value in a sale, said Hartleys Ltd. The mine, expected to yield about 200,000 ounces of gold in 2013, may attract bids for Beadell from AngloGold Ashanti Ltd. (ANG) and Kinross Gold Corp. (K), which both have operations in Brazil, according to Ord Minnett Ltd.
Beadell’s production target “attracts the attention of some very, very serious players, when you get into that kind of territory,” James Wilson, an analyst at RBS Morgans Ltd. in Perth, said in a telephone interview. “It’s a very good target.”
http://www.bloomberg.com/news/2013-03-22/brazil-gold-bar-allure-puts-beadell-in-play-real-m-a.html
I hold BDR
Comments Off on Beadell to produce gold at Tucano for ~ $450 an ounce making it a target


 Lovely Hampton's Inspired Spacious